New article in Earth's Future about the impact of U.S. re-engagement in climate on the Paris targets
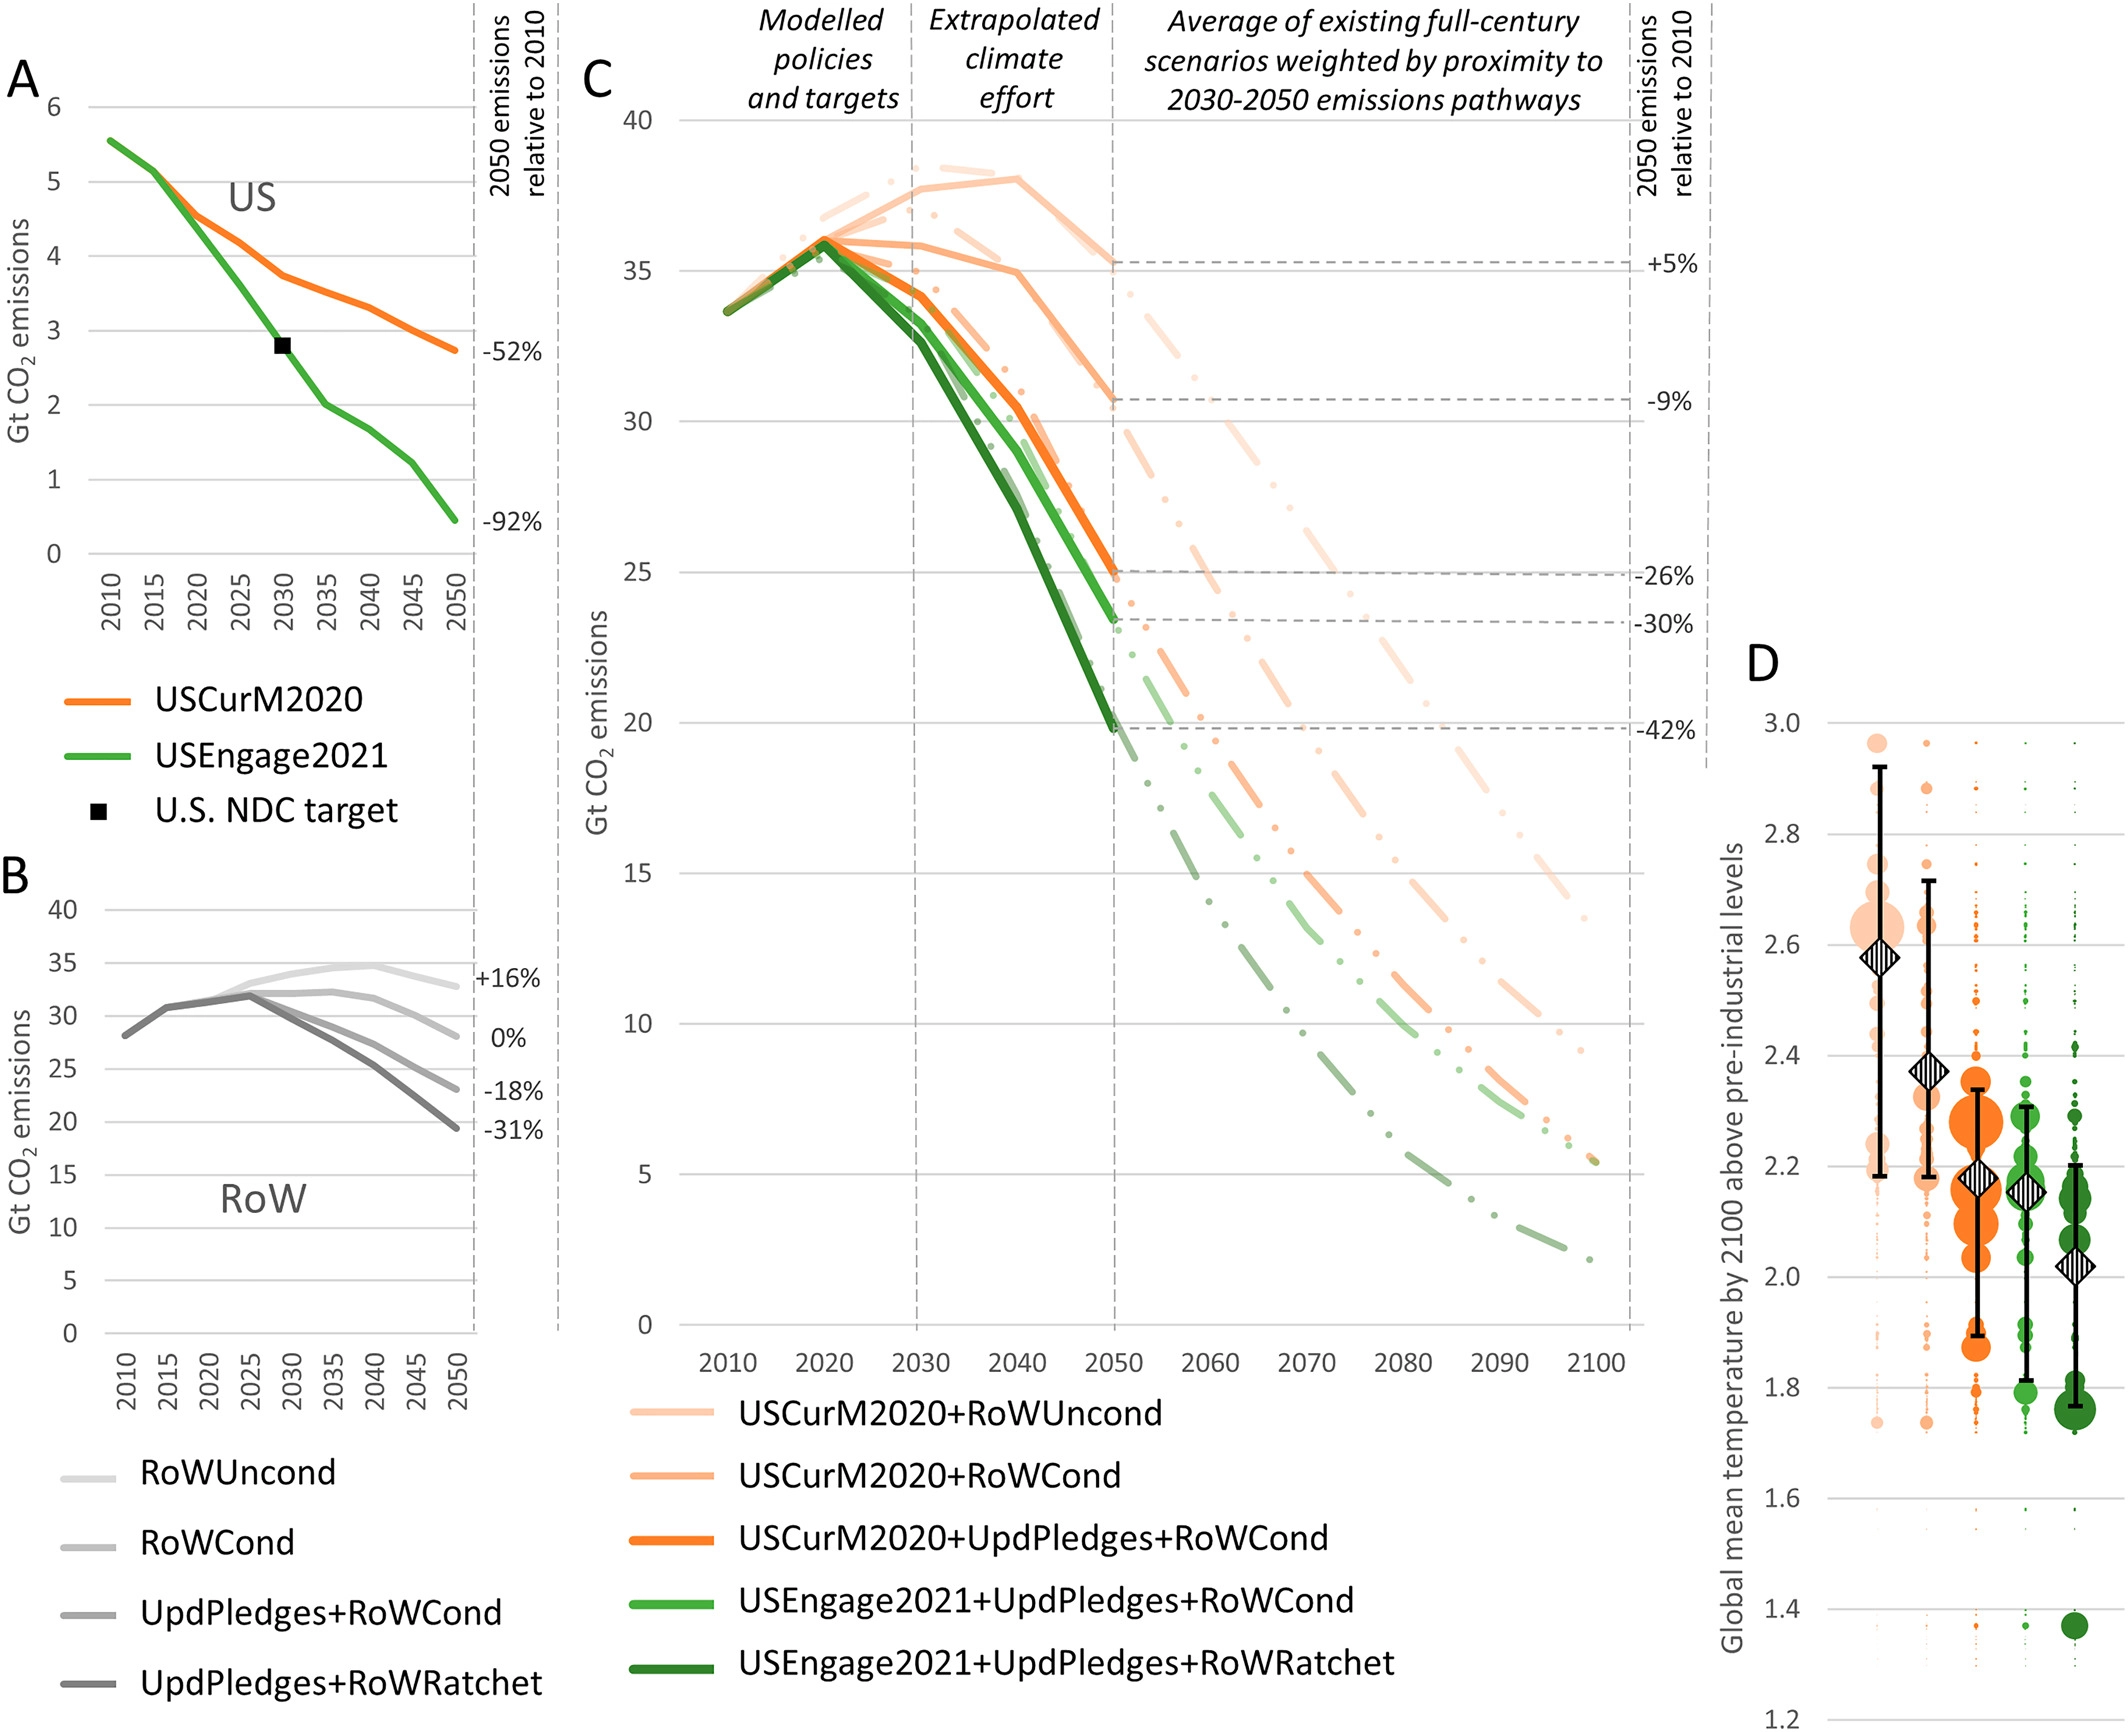
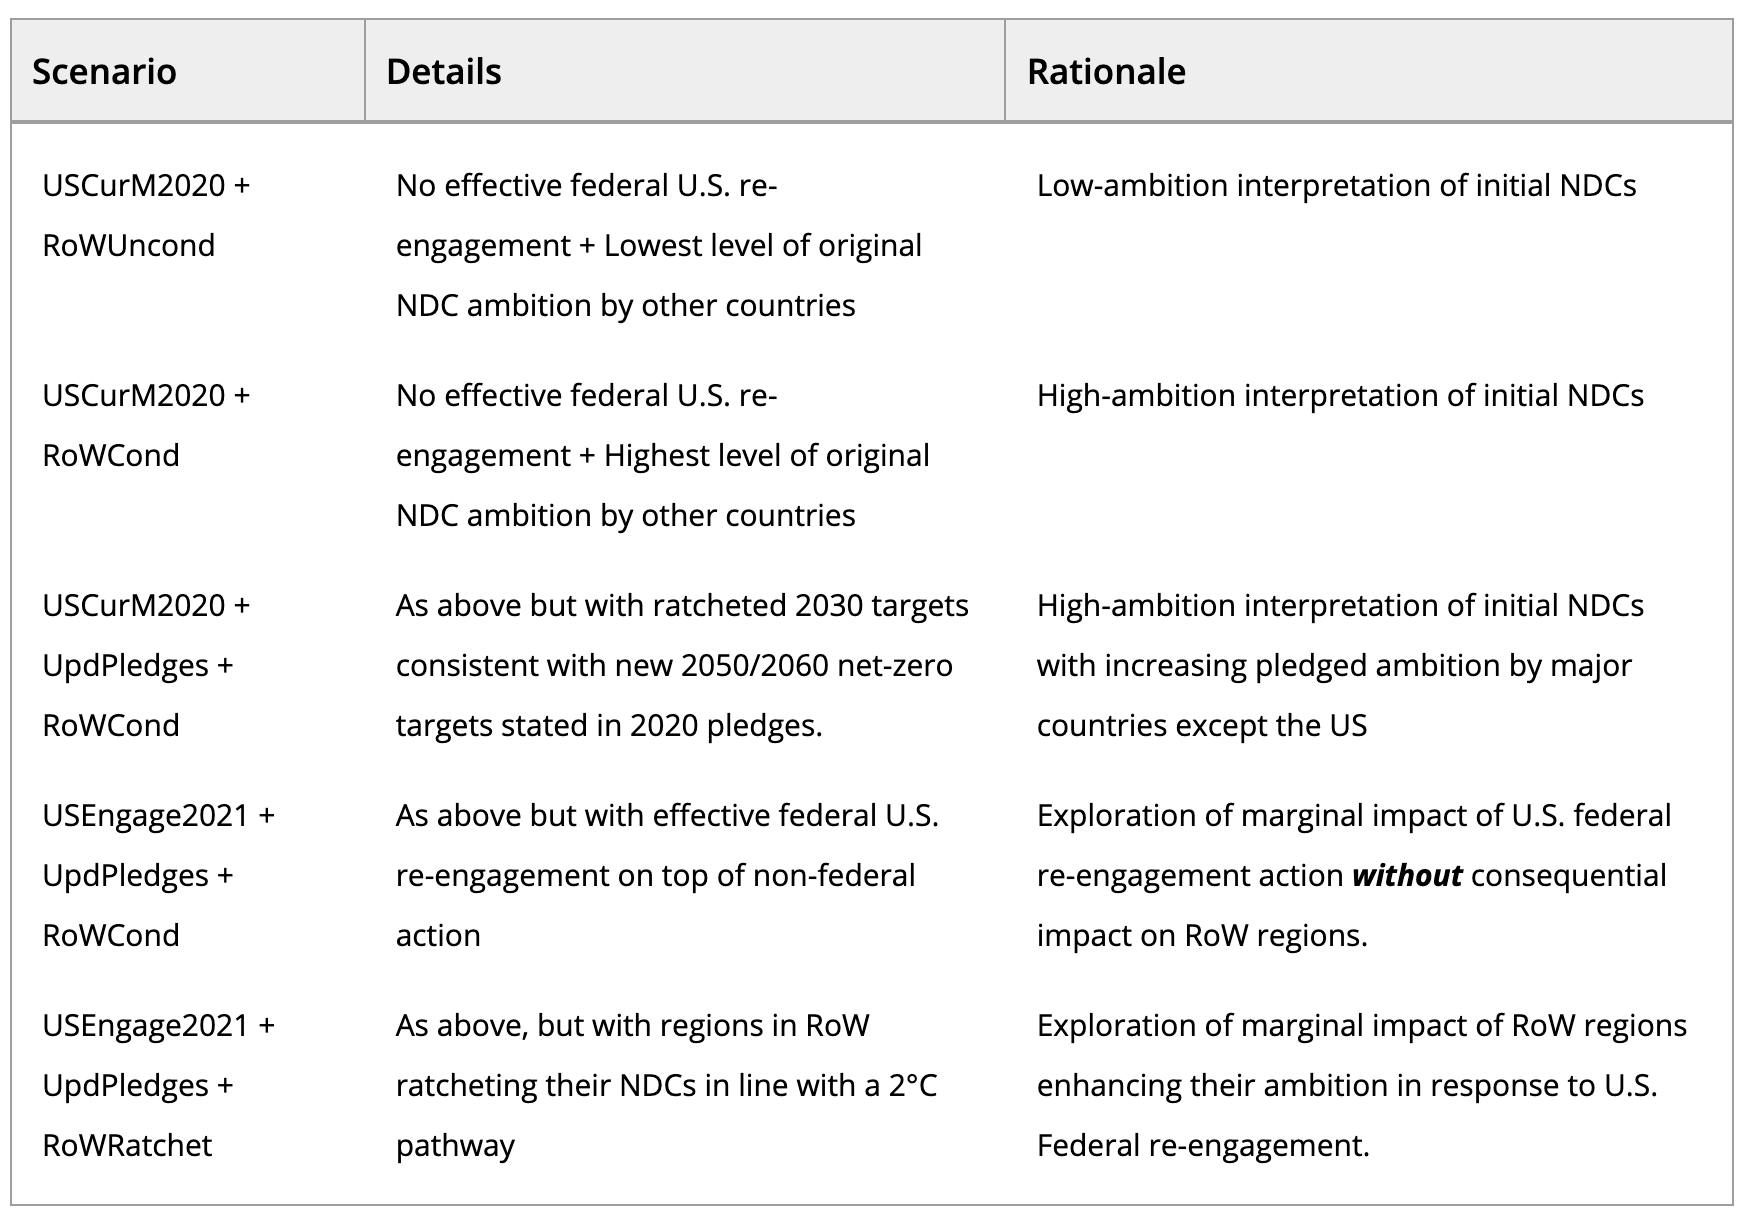
The Paris Agreement seeks to combine international efforts to keep the global temperature increase to well-below 2°C. Whilst current ambitions in many signatories are insufficient to achieve this goal, optimism prevailed in the second half of 2020. Not only did several major emitters announce net-zero mitigation targets around mid-century, but the new Biden Administration immediately announced the U.S.’s re-entry into Paris and a net-zero goal for 2050. U.S. federal re-engagement in climate action could have a considerable impact on its national greenhouse gas emissions pathway, by significantly speeding up the ongoing energy transition. Combined with U.S. re-entry in the Paris Agreement, this could also serve as a stimulus to enhance ambitions in other countries. A critical question then becomes what such U.S. re-engagement, through both national and international channels, would have on the global picture. This commentary explores precisely this question, by using an integrated assessment model to assess U.S. national emissions, global emissions, and end-of-century temperatures in five scenarios combining different climate ambition levels in both the U.S. and the rest of the world. Our analyses find that, on top of enhanced climate commitments by other the major economies, ambitious climate leadership by the Biden Administration through strengthened and convincing national climate action towards 2030 accompanied by an active role on the international climate tables could potentially be the trigger for the world to fulfil the temperature goal of the Paris Agreement.
Full reference: van de Ven, D., Westphal, M., González‐Eguino, M., Gambhir, A., Peters, G., Sognnaes, I., McJeon, H., Hultman, N., Kennedy, K., Cyrs, T., & Clarke, L. (2021). The Impact of U.S. Re‐engagement in Climate on the Paris Targets. Earth’s Future, 9(9). https://doi.org/10.1029/2021EF00207